Measuring excitation and inhibition using electrophysiological data. A comparison of methods using single cell simulation data:
A few weeks ago, I have provided some evidence using single-neuron simulations on the excitation and inhibition balance and how this is measured using the aperiodic component of the spectra. What motivates these simulation studies is to probe further our understand of measurements that captured the biophysical properties of the synaptic inhibition and the overall excitation and inhibition balance of networks in the brain, specially for use in non invasive real time imaging such as EEG.

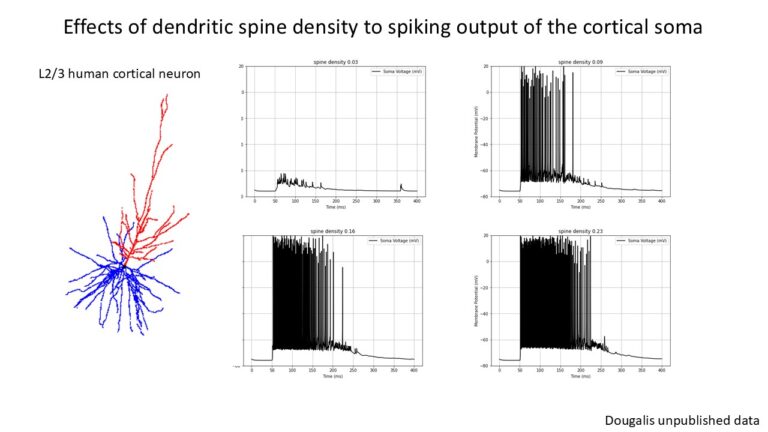
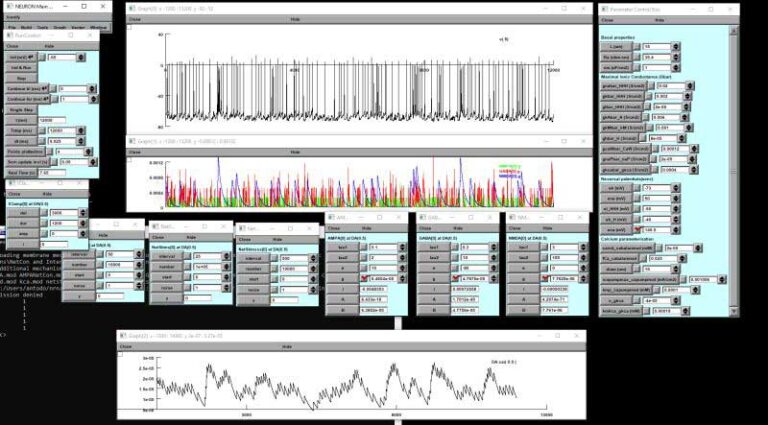
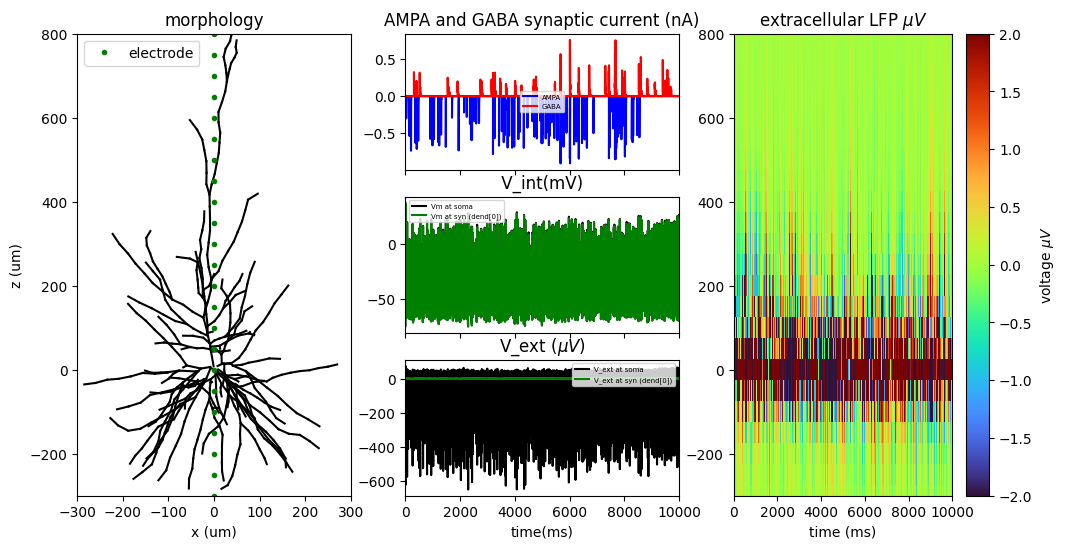
To address this further, I present some biophysically grounded simulations of a multi-compartment human cortical neuron (L2/3) driven to firing by random spontaneous AMPA and GABA synaptic inputs. Neuronal Simulations are computed in NEURON simulation environment while extracellular signals (LFPs) are reconstructed at different spatial locations along the neuron’s z-axis (depth axis) using the LFPy library (also manually by first principles).
Using these simulated data, I compared three widely used putative E/I metrics: the aperiodic (1/f) exponent and the functional E/I (fE/I) measure proposed by Bruining and colleagues (Bruining et la., 2020 Scientific Reports) which is based on detrended fluctuation analysis (DFA). Importantly, these metrics operate on fundamentally different signal representations. The aperiodic exponent is estimated from the broadband signal, whereas Bruining’s fE/I is derived from narrow-band filtered activity (here, the alpha band, 8–12 Hz) and is based on the standard deviation of the detrended fluctuation analysis of the amplitude envelope.
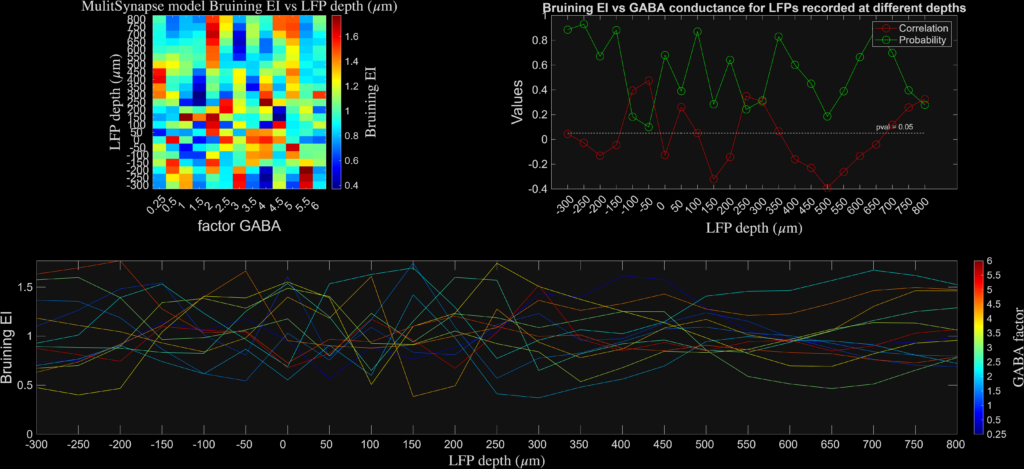
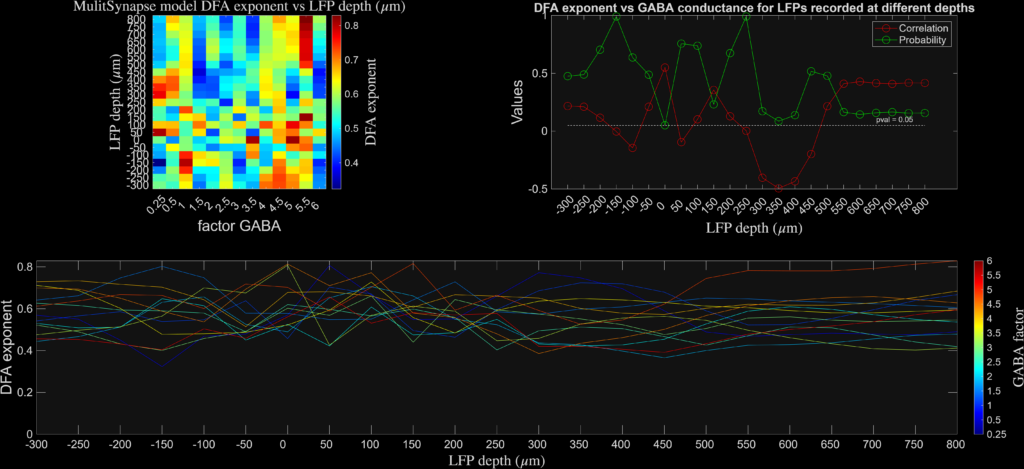
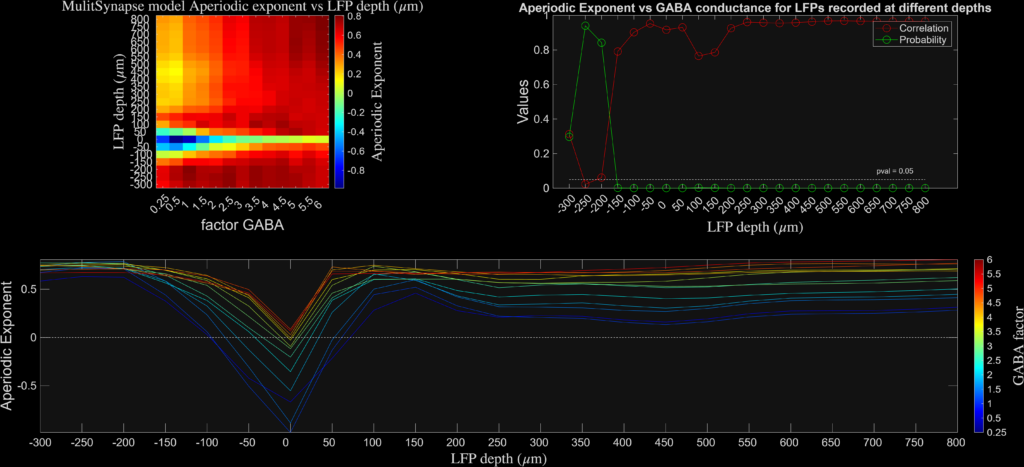
The results are plotted at different levels of cortical depth and for different levels of synaptic inhibition. I found that the aperiodic exponent robustly and monotonically tracked inhibitory synaptic conductance (GABA factor), consistent with prior network-level work (see Gao et al., Neuroimage), while DFA and Bruining’s fE/I did not. Instead, fE/I appeared largely insensitive to synaptic inhibition at the single-neuron level, supporting the view that it reflects the dynamical regime of band-limited population activity rather than biophysical excitation–inhibition balance per se.
Conclusions: Which method aligns with the biophysical interpretations of inhibition and can predict better the E/I balance in single cell data?
Aperiodic exponent stands the tests of time and its values are strongly correlating with the biophysically induced properties of inhibition even on single neurons. As Gao and colleagues have demonstrated in the past, this method also critically ascertains inhibitory strength and modulation in EEG in vivo and in anaesthesia.
These results highlight that EEG “E/I” metrics are not interchangeable: broadband spectral measures and band-limited envelope-based measures probe distinct mechanisms and should be interpreted accordingly. I will expand more on these later issues in a new blog soon.